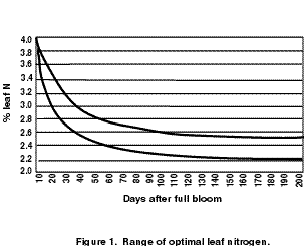
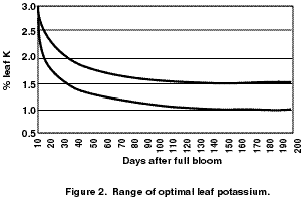
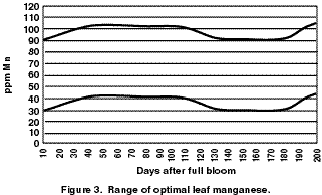
Table 5.Optimal leaf nutrient levels based on summer
analysis.

%

ppm

N
P
K
Ca
Mg

2.3-2.6
0.16-0.26
1.1-1.6
1.2-2
0.18-0.36

B
Fe
Mn
Cu
Zn

30-50
40-100
40-100
5-12
20-50

Table 6.Nitrogen mineralization (N-min) values and
appropriate nitrogen fertilization levels.

N-min

N-fertilization

lbs/acre

kg/ha

lbs/acre

kg/ha N

<26.7
26.7-44.6
>44.6

<30
30-50
>50

26.7-44.6
0-26.7
0

30-50
0-30
0

Table 7.Number of foliar CA-treatments per season in South Tyrol.

Fruit set

Variety

Good

Weak (young trees)

Gala, Elstar, Idared

1-2

2-3

Golden Delicious, Fuji

2-3

4-5

Granny Smith, Red Delicious,
Jonagold, Winesap

3-4

5-6

Braeburn

4-5

6-8

IMAGE 08_Drahorad_nutrition16.gif
IMAGE 08_Drahorad_nutrition20.gif
IMAGE 08_Drahorad_nutrition21.gif
IMAGE 08_Drahorad_nutrition16.gif
IMAGE 08_Drahorad_nutrition23.gif
IMAGE 08_Drahorad_nutrition24.gif
IMAGE 08_Drahorad_nutrition23.gif
IMAGE 08_Drahorad_nutrition27.gif
IMAGE 08_Drahorad_nutrition28.gif
IMAGE 08_Drahorad_nutrition29.gif
IMAGE 08_Drahorad_nutrition30.gif

0

20

40

60

80

100

120

45

54

98

89

76

71

27

April

May

June

July

Aug.

Sept.

Oct.

Month

N mineralized lbs/acre

*kg/ha

40*

60

110

100

85

80

30

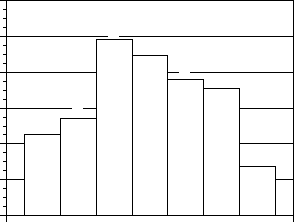
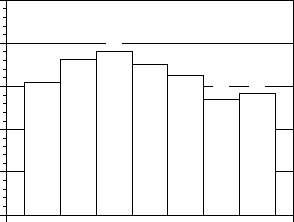
Figure 4. Mean values of N mineralizedin orchard soils.

IMAGE 08_Drahorad_nutrition31.gif

0

50

100

150

200

250

155

181

190

176

163

135

142

1234
Fertigation program

broad-

cast

long N

time

water

soluble

nutrients

shoot growth per tree (inches)

*cm

Figure 5. Tree growth in the 1st year in trees at the Research

Station Laimburg in 1997 for different types of fertilization.

392.5*

460.8

485

448

415

344

362

[made with GoClick]